Lattice Panel for Draw Contour Lines In Wireframe Plots
Source:R/panel.3d.contour.R
panel.3d.contour.RdUsed to superpose contour lines at the bottom, top or on the surface of a wireframe.
panel.3d.contour(x, y, z, rot.mat, distance, type = c("on", "top",
  "bottom"), nlevels = 20, levels = NULL, zlim.scaled, zlim,
  col.contour = 1, ...)
Arguments
| x, y, z, rot.mat, distance, zlim.scaled, zlim, ... | arguments passed to panel.3dwire, the core function of wireframe. |
|---|---|
| type | a string vector. The values allowed are |
| nlevels | the same argument defined in
|
| levels | the same argument defined in
|
| col.contour | color of the contour lines. |
See also
wireframe().
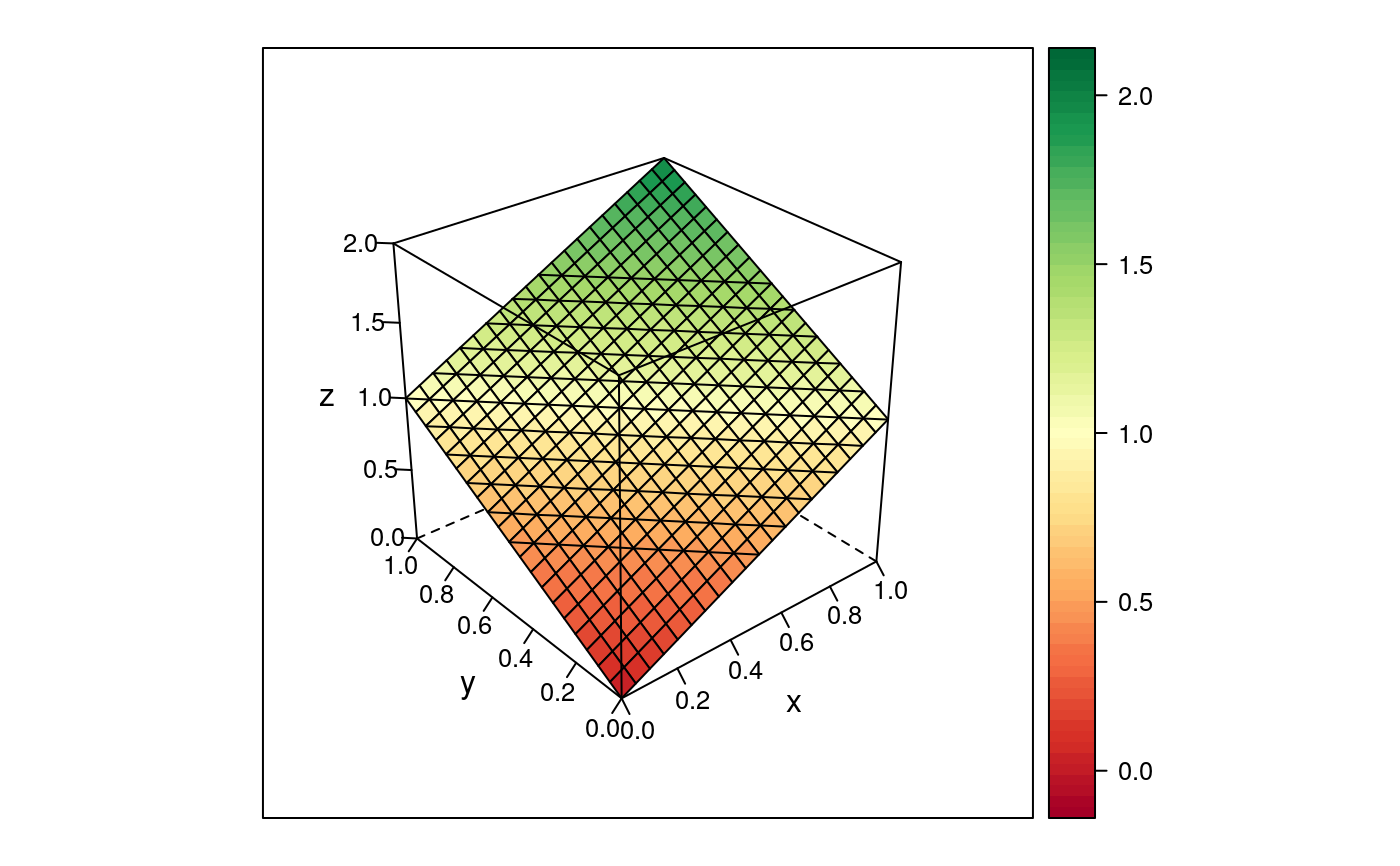
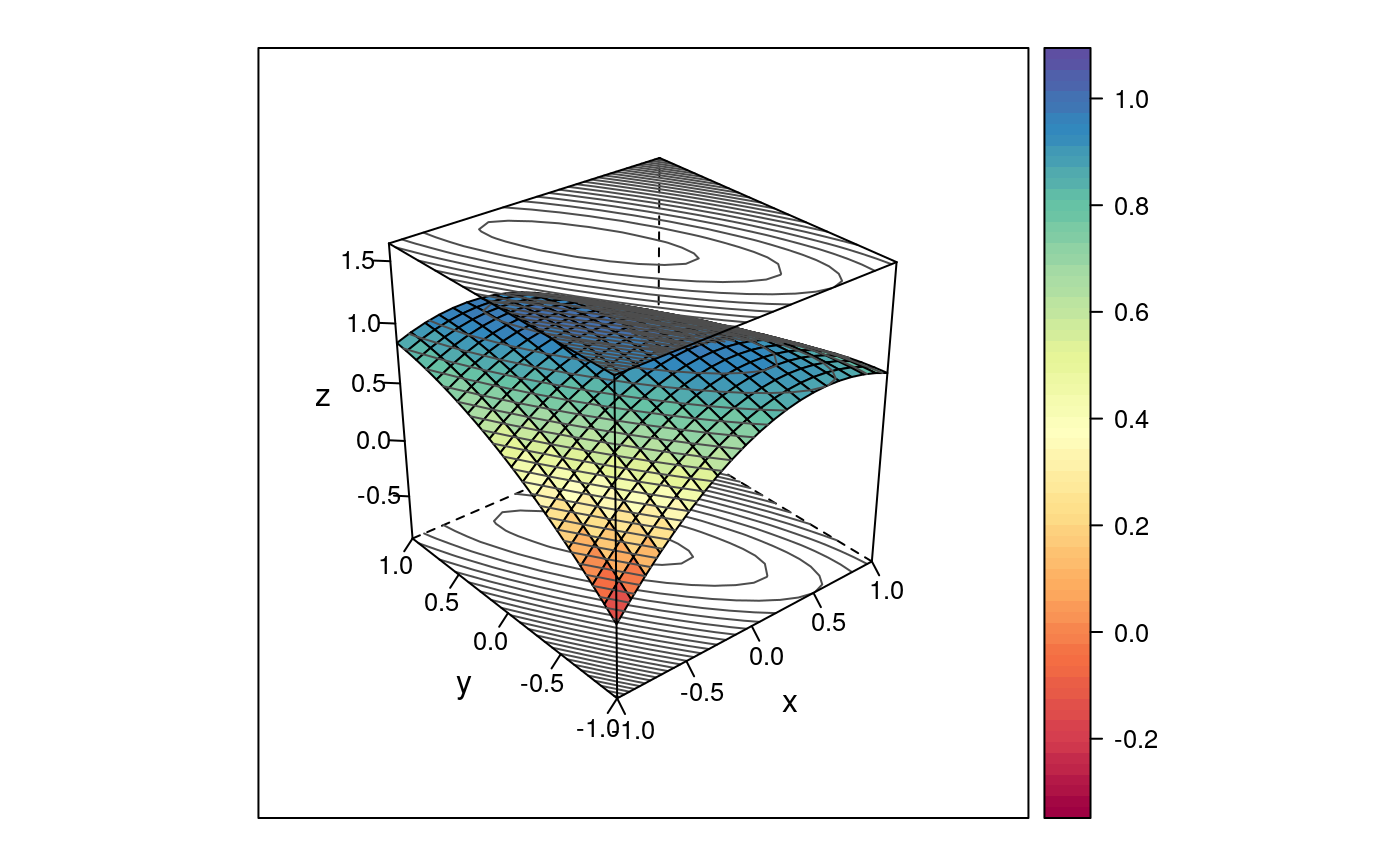
Examples
#>library(RColorBrewer) #-------------------------------------------- # Example 1. # display.brewer.all() colr <- brewer.pal(11, "RdYlGn") colr <- colorRampPalette(colr, space = "rgb") grid <- expand.grid(x = seq(0, 1, by = 0.05), y = seq(0, 1, by = 0.05)) grid$z <- with(grid, x + y) wireframe(z ~ x + y, data = grid, scales = list(arrows = FALSE), panel.3d.wireframe = panel.3d.contour, levels = seq(0.5, 1.5, by = 0.1), type = "on", col.regions = colr(101), drape = TRUE)#-------------------------------------------- # Example 2. colr <- brewer.pal(11, "Spectral") colr <- colorRampPalette(colr, space = "rgb") grid <- expand.grid(x = seq(-1, 1, by = 0.1), y = seq(-1, 1, by = 0.1)) grid$z <- with(grid, 1 + 0.01 * x + 0.05 * y - 0.5 * x * y - 0.5 * x^2 - 0.2 * y^2) wireframe(z ~ x + y, data = grid, scales = list(arrows = FALSE), zlim = extendrange(grid$z, f = 0.5), panel.3d.wireframe = panel.3d.contour, nlevels = 18, col = "gray30", type = c("on", "top", "bottom"), col.regions = colr(101), drape = TRUE)