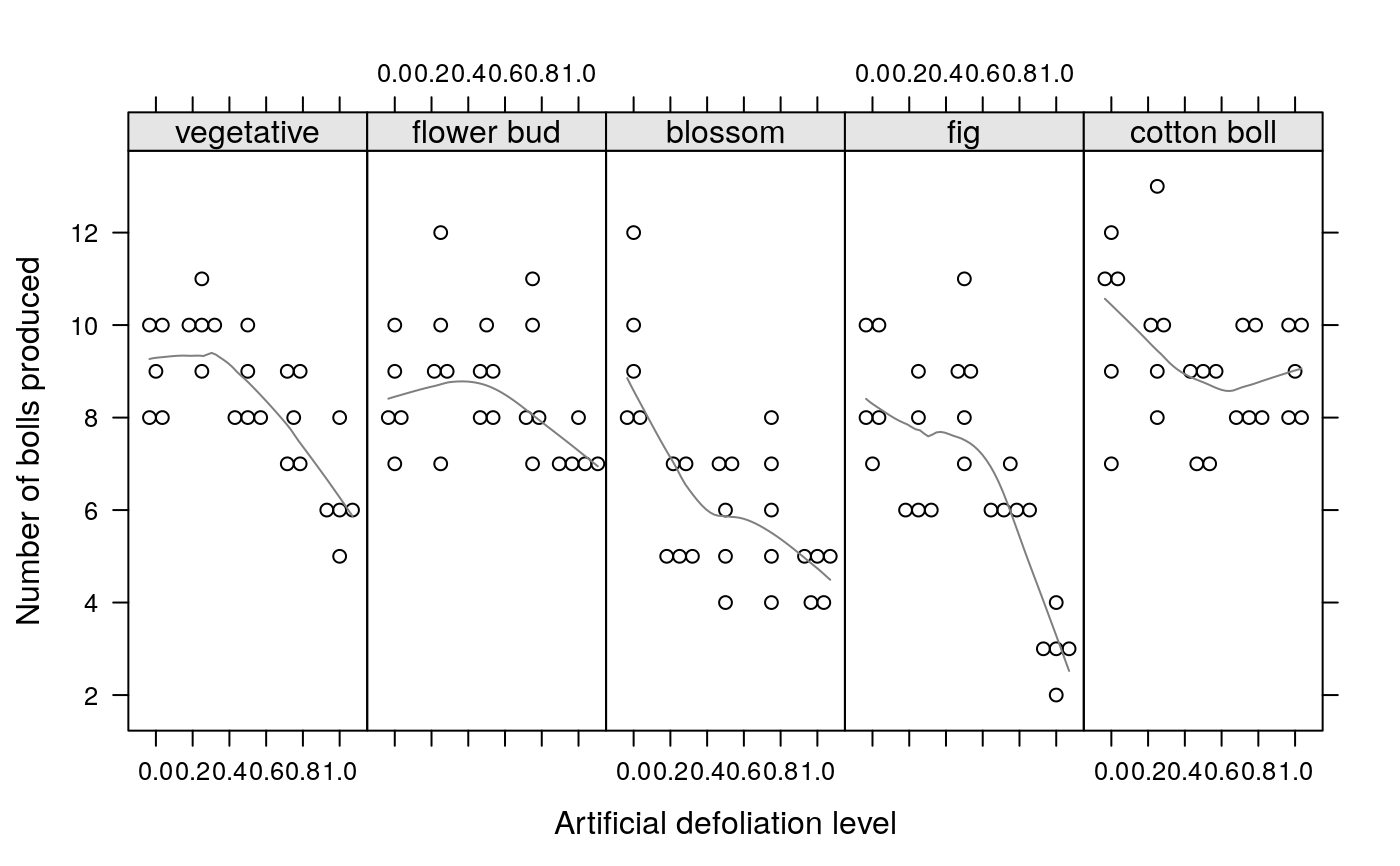
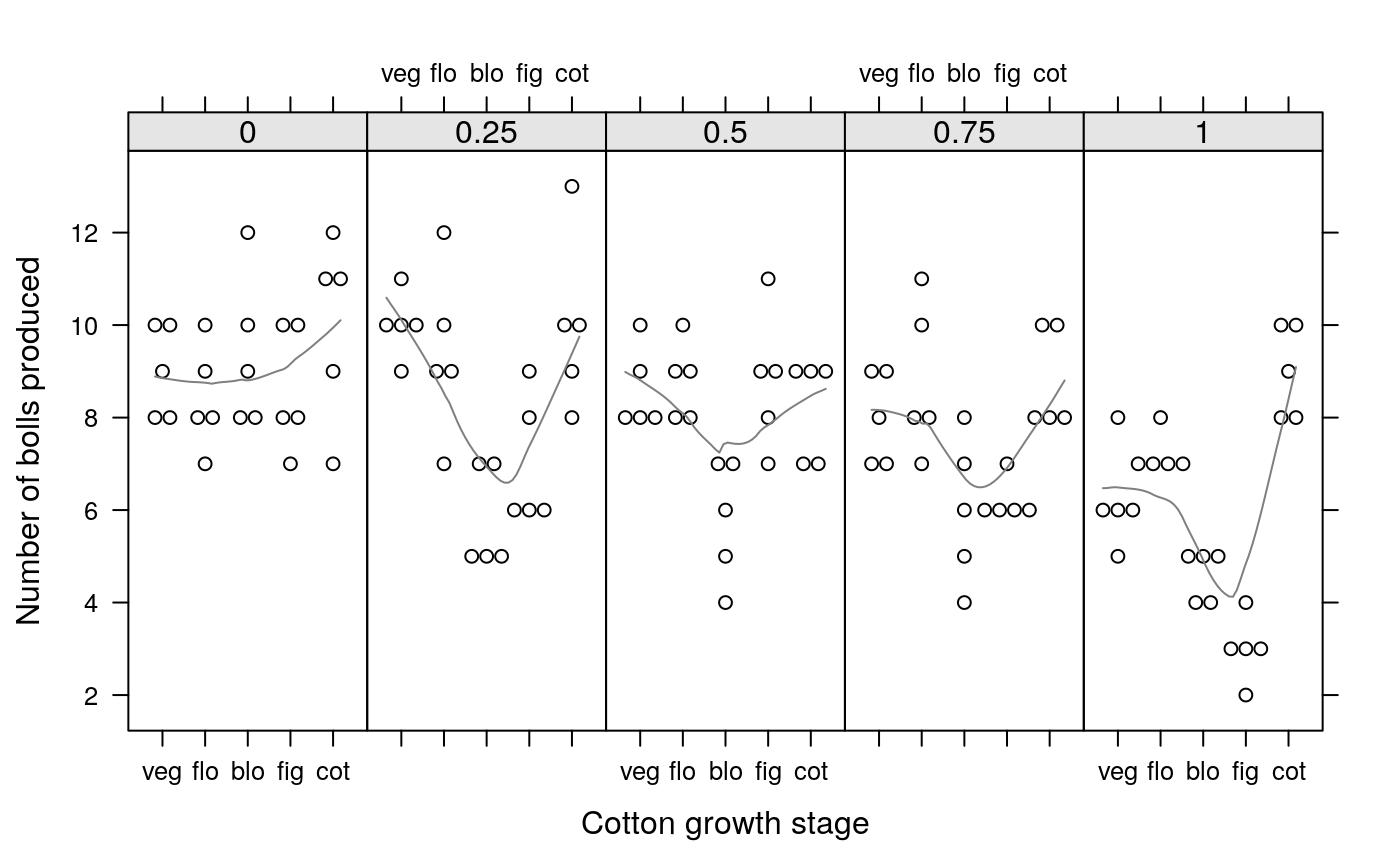
Lattice Panel for Scatter Plots With a Beeswarm Display
Source:R/panel.beeswarm.R
panel.beeswarm.RdUsed to make scatter plot of discrete variables with no
overlapping points. Observations with the same y value are spread
in a sistematic pattern.
panel.beeswarm(x, y, subscripts, spread, ...)
Arguments
| x, y, subscripts, ... | arguments passed to
|
|---|---|
| spread | a numeric scalar indicating how much to spread the
values. This value should be determined by try and error. If you
change the window plot dimensions, you should determine a new
value. As an advice, always use a |
See also
xyplot().
Examples
est.ing <- c("vegetative", "flower bud", "blossom", "fig", "cotton boll") cap <- expand.grid(rept = 1:5, des = seq(0, 100, l = 5)/100, est = factor(est.ing, levels = est.ing)) cap$nc <- c(10, 9, 8, 8, 10, 11, 9, 10, 10, 10, 8, 8, 10, 8, 9, 9, 7, 7, 8, 9, 8, 6, 6, 5, 6, 7, 8, 8, 9, 10, 9, 12, 7, 10, 9, 8, 9, 9, 10, 8, 11, 10, 7, 8, 8, 7, 7, 7, 7, 8, 10, 9, 8, 12, 8, 7, 5, 5, 7, 5, 6, 5, 7, 4, 7, 8, 5, 7, 6, 4, 5, 5, 4, 4, 5, 8, 10, 7, 8, 10, 9, 6, 6, 8, 6, 9, 7, 11, 8, 9, 6, 6, 6, 6, 7, 3, 3, 2, 4, 3, 11, 7, 9, 12 , 11, 9, 13, 8, 10, 10, 9, 7, 7, 9, 9, 8, 8, 10, 8, 10, 9, 8, 10, 8, 10) library(lattice) # x11(width = 7, height = 2.8) xyplot(nc ~ des | est, data = cap, layout = c(5, 1), as.table = TRUE, col = 1, type = c("p", "smooth"), col.line = "gray50", xlim = extendrange(c(0:1), f = 0.15), xlab = "Artificial defoliation level", ylab = "Number of bolls produced", strip = strip.custom(bg = "gray90", factor.levels = est.ing), spread = 0.07, panel = panel.beeswarm)# x11(width = 7, height = 2.8) xyplot(nc ~ est | factor(des), data = cap, layout = c(5, 1), as.table = TRUE, col = 1, type = c("p", "smooth"), col.line = "gray50", xlim = extendrange(c(1, nlevels(cap$est)), f = 0.2), xlab = "Cotton growth stage", ylab = "Number of bolls produced", strip = strip.custom(bg = "gray90"), scales = list(x = list( at = 1:nlevels(cap$est), labels = substr(levels(cap$est), 1, 3))), spread = 0.35, panel = panel.beeswarm)