Used to plot confidence bars or confidence bands in lattice plots.
panel.cbH(x, y, ly, uy, subscripts, cty, col.line = plot.line$col,
  lwd = plot.line$lwd, desloc = NULL, fill = 1, alpha = 0.1,
  length = 0.05, ...)

prepanel.cbH(y, ly, uy, subscripts)
Arguments
| x, subscripts, col.line, lwd, ... | arguments passed to
|
|---|---|
| y | central value (point estimate). |
| ly | lower limit. |
| uy | upper limit. |
| cty | string that is the confidence type. Values current acepted
are |
| desloc | a numeric vetor with length equal to |
| fill | a color to fill the polygon defined by the confidence
bands. Default is 1 that is the black color. Not used when
|
| alpha | transparecy level for the polygon defined by the
confidence bands. Default is 0.1. Not used when |
| length | is the length of the upper/lower error bars
whiskers. Default is 0.05. Not used when |
Value
None is returned.
Examples
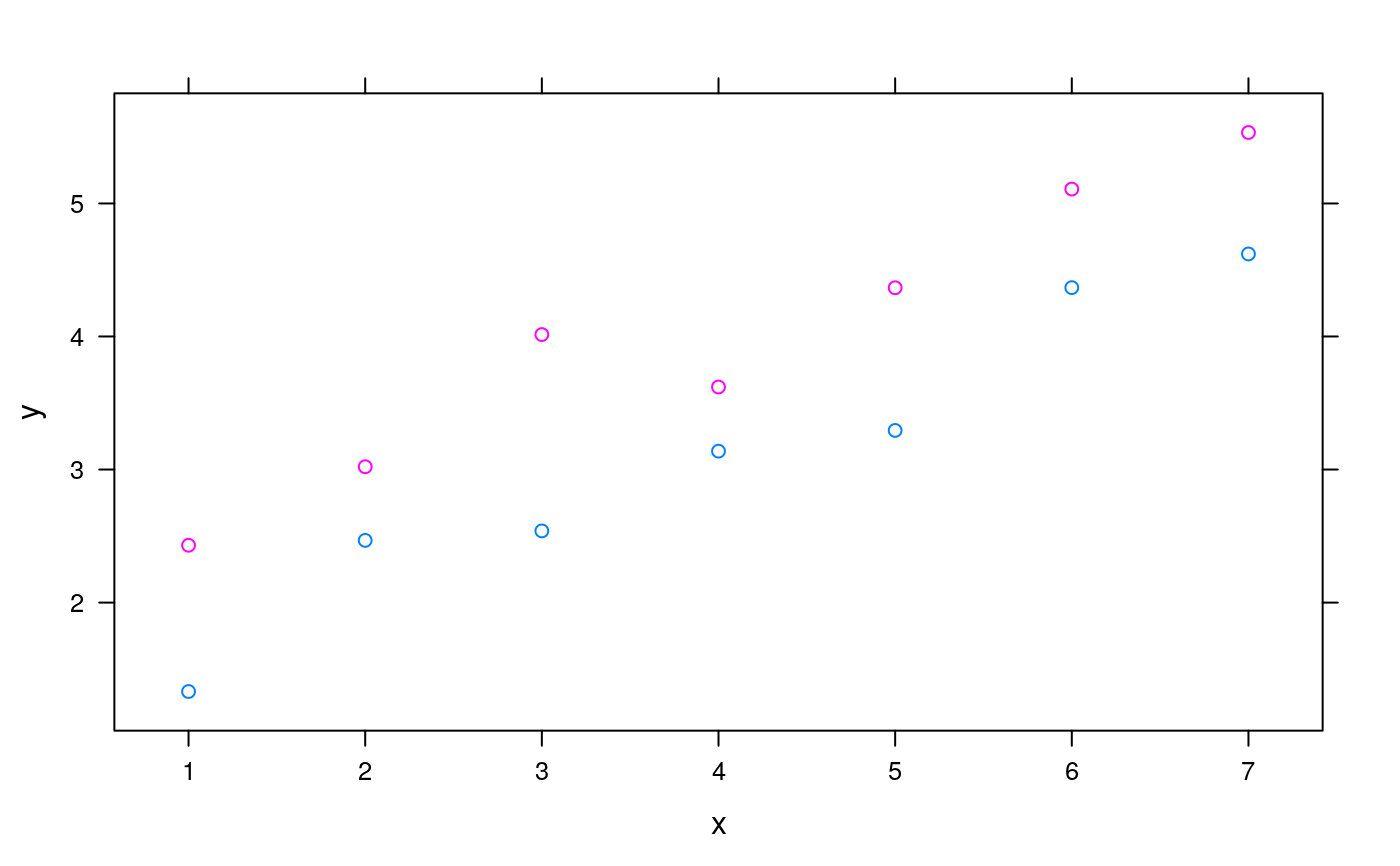
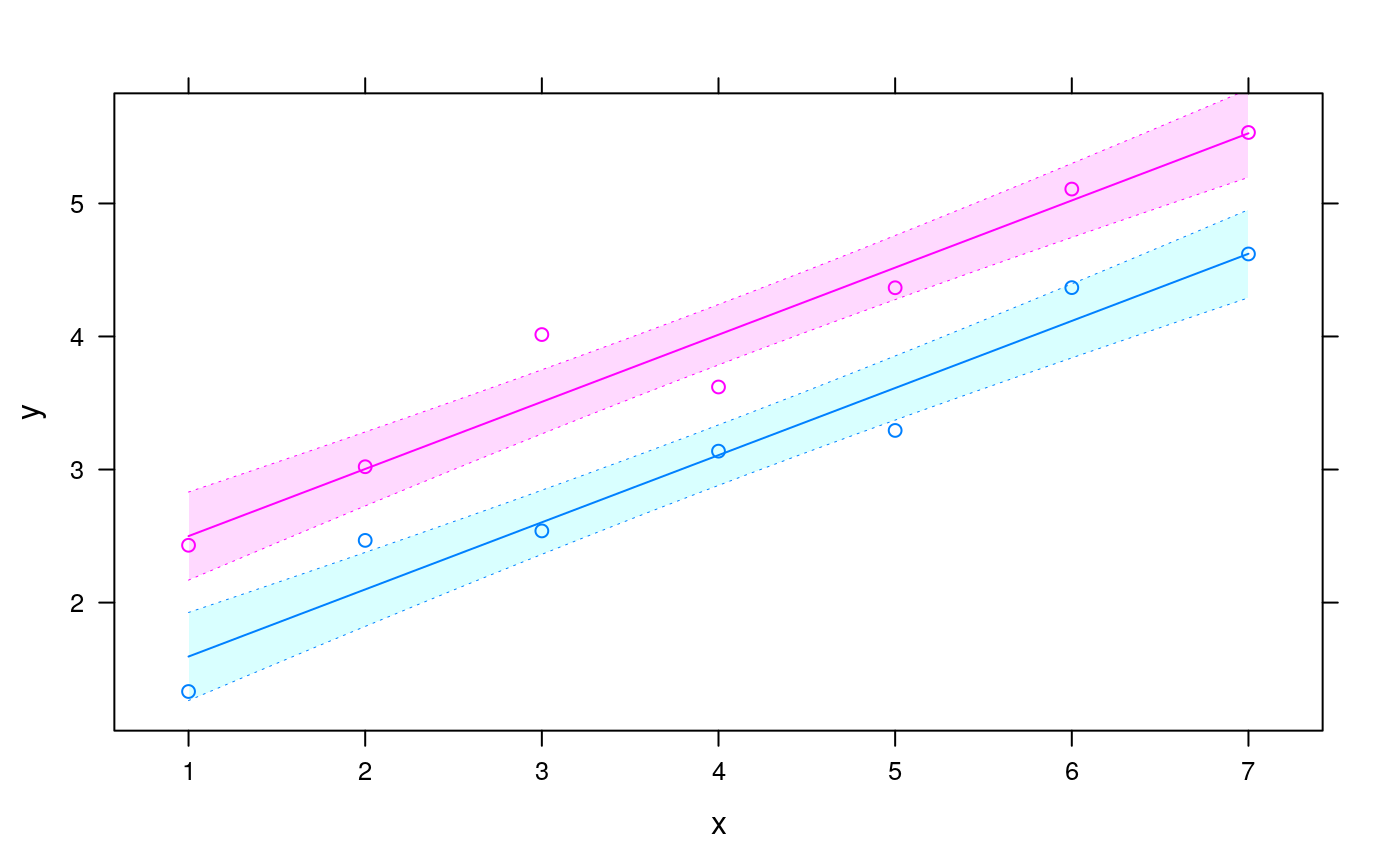
library(lattice) library(latticeExtra) #-------------------------------------------- m0 <- lm(sqrt(dist) ~ speed, data = cars) pred <- with(cars, data.frame(speed = seq(min(speed), max(speed), length.out = 20))) aux <- predict(m0, newdata = pred, interval = "confidence") pred <- cbind(pred, aux) xyplot(sqrt(dist) ~ speed, data = cars, ylab = expression(sqrt(distance)), xlab = "Speed") + as.layer(xyplot(fit ~ speed, data = pred, type = "l", ly = pred$lwr, uy = pred$upr, cty = "bands", fill = "blue", alpha = 0.3, prepanel = prepanel.cbH, panel = panel.cbH))#-------------------------------------------- m1 <- lm(weight ~ feed, data = chickwts) pred <- with(chickwts, data.frame(feed = levels(feed))) aux <- predict(m1, newdata = pred, interval = "confidence") pred <- cbind(pred, aux) xyplot(weight ~ feed, data = chickwts, xlab = "Feed", ylab = "Weight") + as.layer(xyplot(fit ~ feed, data = pred, ly = pred$lwr, uy = pred$upr, cty = "bars", desloc = rep(0.15, length(pred$fit)), prepanel = prepanel.cbH, panel = panel.cbH))#----------------------------------------------------------------------- set.seed(123) da <- expand.grid(trt = gl(2, 1), x = 1:7) da$y <- with(da, as.integer(trt) + 0.5 * x + rnorm(x, 0, 0.3)) xyplot(y ~ x, groups = trt, data = da)m2 <- lm(y ~ trt + x, data = da) pred <- with(da, expand.grid(trt = levels(trt), x = seq(min(x), max(x), length.out = 20))) aux <- predict(m2, newdata = pred, interval = "confidence") pred <- cbind(pred, aux) xyplot(y ~ x, groups = trt, data = da) + as.layer(xyplot(fit ~ x, groups = trt, data = pred, type = "l", ly = pred$lwr, uy = pred$upr, cty = "bands", alpha = 0.75, prepanel = prepanel.cbH, panel = panel.superpose, panel.groups = panel.cbH), under = TRUE)